Analytics Overview: traffic and timing at a glance
Go to Apps → Vosaire: AI Chatbot & Sales → Analytics. The Overview tab (the default view) is available on every plan and covers basic traffic patterns.
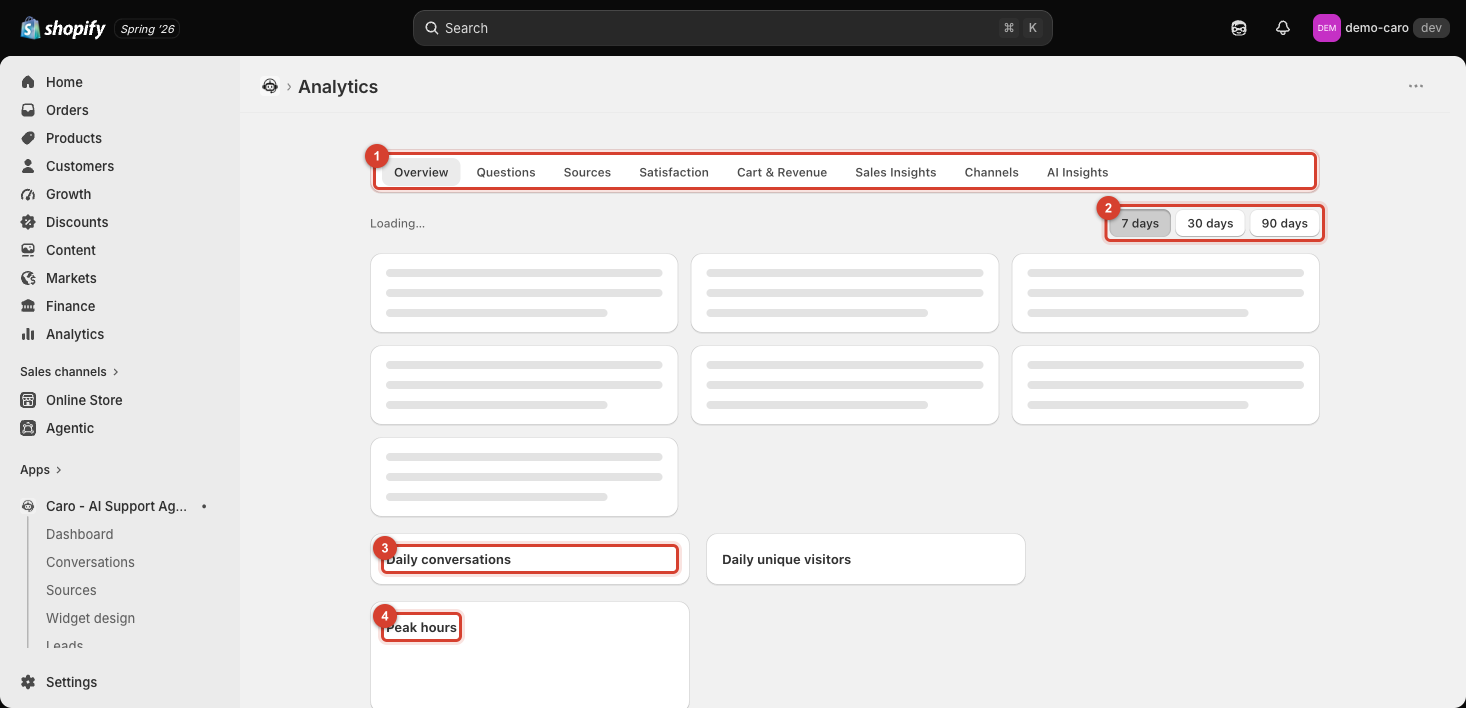
The 8 tabs
Analytics is organized into: Overview, Questions, Sources, Satisfaction, Cart & Revenue, Sales Insights, Channels, and AI Insights. Several of these require a plan upgrade — see each tab's own article for specifics.
Date range
Every tab shares the same date range control: 7 days, 30 days, or 90 days, at the top right.
What's on Overview
The tab opens with a row of at-a-glance numbers — Conversations, Unique visitors, Resolution rate, Escalation rate, Satisfaction, Knowledge gap, and Time saved — followed by an Outcome breakdown (resolved / escalated / unanswered) and Response ratings, then the charts below:
- Daily conversations — how many conversations happened each day in the selected range.
- Daily unique visitors — distinct visitors, as opposed to total conversations (one visitor can start more than one conversation).
- Peak hours — when during the day conversations are concentrated, useful for knowing when a human should be available if you offer channel-based support.
- Visitors by country — a breakdown of where your chat traffic comes from, with a per-country count of questions and conversations.
Why this tab is worth checking weekly
Even without any paid-plan analytics, Overview alone tells you whether traffic is trending up or down and when your support load actually happens — useful context before deciding whether to invest in more Actions or Channels.